The nature of doing business has undergone significant changes in the last couple of decades and continues to evolve rapidly. As the following customer service statistics show, one of the most striking aspects of these changes is in the factors that customers give the most importance to when making their purchase decisions. While price and quality remain essential, customer experience can make or break market success. Growing service expectations are accompanied by significant changes in how customers choose to interact with businesses.
Customer Service Statistics (Editor's Choice)
- 96.2% of customers will leave a business for poor customer service.
- 62% of customers will pay more for good customer service.
- 66% of customers try to resolve the issue on their own before reaching out.
- 36% of consumers actively share customer experience on social media.
- Increasing customer retention rates by 5% boosts profit by up to 75%.
- 68% of customers find it annoying when transferred between the departments.
- 40% of customers chose a communication channel depending on the complexity of their issue.
Statistics on Customer Service and Behavior
1. Most customers will leave a business because of poor customer service.
A whopping 96.2% of customers would leave a brand if they have a disbalance between expectations of customer service vs customer experience. 27.9% of those respondents reported being “extremely willing” to do so, 32.7% “very willing,” 35.5% “somewhat willing.” Only 3.8% would stay loyal to a brand despite bad customer service.
(ACA Survey)
2. Nearly two-thirds of customers consider email to be the easiest communication channel.
By examining communication channels that are the easiest to use, customer service stats reveal email currently ranks first for 65.7% of customers. Only 14% found it difficult to communicate. Phone ranks next for communication ease with a close 65.2%, followed by texting with 60.3%. The two bottom places were still reserved for apps and chatbots, with 53.8% and 51.6% of respondents.
(ACA Survey)
3. Half of customers with less than $50,000 yearly income would pay more for good customer service.
The research examined the factor of a yearly income and its relation to the importance of customer experience. It seems that consumers' value of customer service is only slightly contingent on income. Customer service facts show that 50% of people who earn less than $50,000 would pay more for exceptional service. The percentage increases with the income and goes up to 66% for the group earning over $100,000.
(ACA Survey)
4. More than 60% of customers will pay more for good customer service.
The user-centric approach in the virtual world has raised our standards as consumers. The direct consequence is that 62% admit they would gladly pay more money for customer service excellence. 26% reported they were indifferent. Only 12% of customers wouldn't agree to pay additionally to receive better customer service.
(ACA Survey)
5. Nearly 60% of US customers have contacted customer service in the past month.
People wouldn't care about customer service levels if they didn't need help occasionally. When people were asked if they'd reached out to customer service in the month before, customer service statistics show 58% said they have. Respondents were US adults, and these customer service studies are being conducted for 5 years now. The number has declined since 2015, when it was 71%, gradually falling to 58% in 2020.
(Statista)
6. 66% of customers try to resolve the issue on their own before reaching out.
Two-thirds of customers are happy to find answers to their queries on their own. Customers expect companies in 2021 to come up with features that promote self-reliance. Otherwise, you'll be categorized among companies with bad customer service. 32% always try to resolve the issue independently, while another 34% said it's the case most of the time. Customer service facts and figures show only 8% said never.
(CCSI)
7. 48% of customers use a mobile device to visit the company's website, searching for a solution.
Mobile accounts for nearly 50% of total internet traffic nowadays, and the number has been exponentially rising over the last years. 48% of consumers said that before reaching out to customer service, they visit a website via mobile in search of a solution. 38% and 34% do so on their laptop or desktop devices, and 15% on tablets. Note that customer service levels can be improved by better optimization for various devices, focusing on mobile-friendly solutions.
(CCSI)
8. More than one-third of customers actively share experiences on social media.
In the latest survey, 64% of respondents said they never share such experiences on social platforms. Social media customer service statistics show that out of those 36% that tell others about it, 39% prefer Facebook. You should keep track of mentions and promptly respond and apologize, offer solutions, discounts, or similarly, especially if people report bad customer service. Online reviews can spread like wildfire, and you don't want to end up among companies that failed due to poor customer service.
(CCSI)
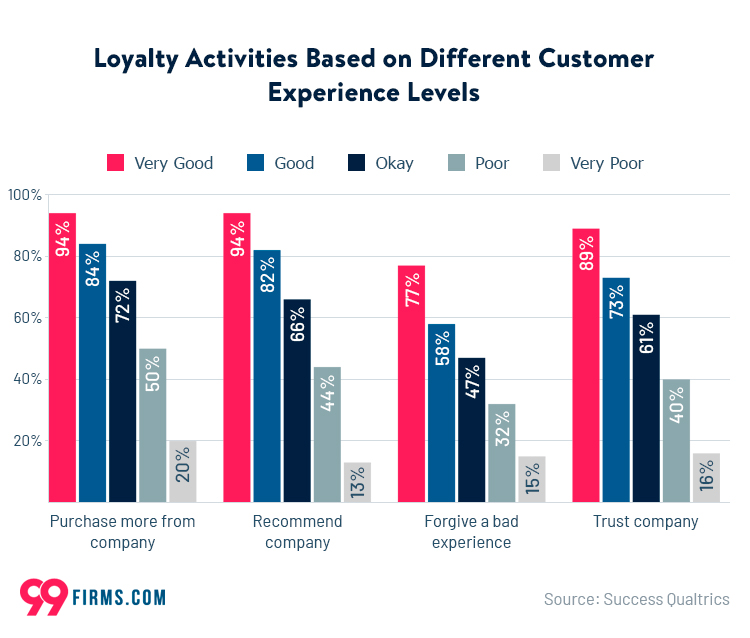
9. 88% of American consumers are very likely to recommend a company with a high rating of customer service.
Data from a survey on customer loyalty from 2020 shows 94% of consumers will reward a company if they provide customer service excellence. For ones they rate as good, the recommendation rate is at 82%. That's an overall 88% recommendation rate for positive experiences.
(Success Qualtrics)
Customer Service Statistics – The Business Gamechanger
10. More than 70% of customers feel loyal to a brand or a company.
Consumers' loyalty towards a brand is not easy to achieve and is a complex process that includes many variables — prices, overall success, marketing, support, etc. Providing an experience that will make them ignore your competitors is the desirable result of any interaction. Almost three-quarters of customers feel loyal to a brand or a company, 74% exactly. Loyalty means multiple purchases and often referrals.
(CX Trends Report)
11. 57% of customers think customer service makes them loyal to a brand.
Several major factors influence customers’ loyalty, and the price ranks first for 62% of them. Customer service follows with 57%, as the latest customer service facts show. The third category impacting the decision for over 50% was product/service offerings.
(CX Trends Report)

12. More than half of customers report going out of their way to buy from a favorite brand.
Following up on the loyalty, for 52% of customers, it matters to the point of taking extra steps just to buy from a favorite brand. Sometimes it's not even about the product itself, but rather about being a part of a social group. Take distinctive brands like Coca-Cola, Nivea, and Nike, for example. These brands imply standards people are not willing to give up.
(CX Trends Report)
13. Customer satisfaction statistics show 60% of US customers did more business with companies with great customer service.
Customers don't just make repeat purchases; they also make high-value purchases to reward businesses that respect promises in customer service vs customer support delivery. Customer service research shows customers have become increasingly discerning about the purchase experience. 60% of customers did more business after a pleasant experience, which can ultimately make or break a venture. There's been a decline since 2017 when the percentage was 68%.
(Statista)
14. Two-thirds of US consumers see customer service as very important when choosing a brand.
Continually improving your customer service is among the top 5 critical factors for customer retention. Customer service facts show 66% of US customers cited customer service as a very important factor for choosing a brand.
(Statista)
15. Customer support applications ranked third in volume of the CRM market.
A report on the global CRM market shows that apps focused on customer service and relationship management are the third most-used. The Customer Support and Contact Centre category accounted for over 20% of the global CRM market. Lead Generation and Customer Retention was first, and Customer Management second most used.
(Fortune Business Insights)
16. Increasing customer retention rates by 5% can increase profits by up to 75%.
One of the salient customer service facts is that while it might be common sense that high customer retention has a direct impact on the bottom line, many executives do not realize how significant of an impact it can make. Only a 5% increase in retention rates can increase your profits by 75%. The data indicates that investing in customer service makes great sense, even if evaluated only from the perspective of monetary gains.
(Super Office)
17. More than half of customers expect offers to be personalized.
New technologies and growing competition have made customers raise their expectations. They want to feel that you as a company care about them as an individual, and the number exceeded half the customers in 2020. In 2019, 49% of customers thought so. In reality, 34% of companies have such an approach.
(Salesforce)
18. Companies where customer service vs customer satisfaction levels are above average have better financial performance.
Customer service facts and figures show how relevant financial aspects are higher for companies with excellent customer service. 67% of such companies reported three distinctive categories — 67% profitability, 65% revenue growth, and 65% employee retention. For companies at or below the industry average customer service levels, the numbers were 43%, 36%, and 43%.
(Global State Qualtrics)
19. 46% of teams use CSAT as a success measure.
The data from clients' feedback should be a tool for improving your performance, but 28% of teams don't measure customer satisfaction at all. The most popular method for those who keep track of this is CSAT, for 46% of companies. Customer service statistics show the average handle time, first reply time, and CES is also used as a measure by nearly 20% each.
(CX Trends Report)
20. Most sales leaders say their teams communicate with customer service regularly.
Customer service and sales teams should be partners as the two spend most of their time with clients. A whopping 90% of leaders report communicating with the customer service team daily or weekly. Another fact emphasizes the importance of collaboration between the two groups — over 60% of sales leaders state that they communicate the most with the company's customer service team.
(CX Trends Report)
21. Companies using chatbots are 60% more likely to improve resolution times.
Chatbots fulfill multiple functions as they cater to consumers, the first and the most important being 24/7 service. Customer service statistics for Australia show they are the most progressive in embracing advanced technologies Down Under, including chatbots. Constant availability means people can get immediate answers and, in some cases, resolve the issue they're having. The fact is — companies using chatbots are 60% more likely to improve their problem resolution times.
(Tech Republic)
22. The median yearly salary for customer service representatives is $47,678.
The average customer service representative base salary is $47,678 in the US, ranging from $42,397 to $54,719, depending on experience, education, and other skills. Going north, the median is similar — $42,600, as the latest customer service statistics for Canada show.
(Salary, SalaryExplorer)
Common Customer Service Problems and Issues
23. Rudeness is the primary reason for customer service complaints.
The research examined companies with poor customer service, and we can see that apathy or rudeness coming from representatives is the biggest problem in customer service. 48.5% of consumers believe so. Customer service statistics show not being treated like a valuable customer follows with 42.1%. The lack of expertise is ranked third with 41.7%, and slow response time comes in fourth, with 40.9% of customers reporting it as a problem.
(ACA Survey)

24. A representative's lack of knowledge or ability to resolve the issue is the most frustrating aspect of the customer service sector.
On the list of poor customer service examples, the worldwide report showed 4 issues that are the most frustrating. With 40% overall and 36% in the US, the worst-case scenario is if a representative lacks knowledge or ability to solve the problem. Second place went to having to repeat information multiple times for 29% of global consumers and 31% in the US. Difficulty reaching a live agent and not being able to resolve the issue on their own were also cited as quite frustrating for 24% and 7% of global consumers, as the latest customer service stats show. For the US, it was 20% and 12%.
(Statista)
25. Nearly 70% of customers find it annoying if they're being transferred between departments.
Your company ought to provide a unique experience, and when a call is being transferred between departments, it doesn't seem that way. Over 70% of consumers expect that departments will collaborate and have access to the same information. 68% find it very annoying when the call is transferred and rate it as poor customer service.
(CX Trends Report)
Customer Experience Priorities
26. Fast, helpful, and friendly are the top words customers believe should describe any customer service representative.
People were asked to use words that describe customer service in ideal conditions. Customer service facts related to expectations show that the top 3 ranked were fast, helpful, and friendly. Customers today crave convenience, which by definition includes prompt response. Finding resolutions to their problems and answers to their questions came next, defined as helpful. Soft skills like empathy, respect, and understanding were ranked third most important.
(ACA Survey)
27. Quickly resolving an issue ranks as the biggest priority in exemplary customer service, for over 60%.
For the most important aspect of customer service, over 60% believe it's that the issue can be resolved quickly. Statistics on customer service show availability comes in next, with over 40% of customers appreciating 24/7 support. Representatives being friendly and available on their preferred communication channel rank third and fourth, both with over 30%.
(CX Trends Report)

28. Less than 30% of companies offer modern ways of interaction (apps, self-service, bots, etc.)
According to most customers' preferences, there are many missed opportunities in using technology in customer service. Automation of responses and some processes is desirable and even expected, especially for millennials and Gen Z age groups. AI-driven software is used by less than 30% of companies worldwide.
(CX Trends Report)
29. 40% of customers chose a communication channel depending on the complexity of their issue.
A preferred way of communication will heavily depend on an issue a customer's having. 40% of them will do so based on the complexity of said issue. Sometimes it's easier to talk with a representative, while other things can be solved via email. Customer service data shows urgency is another relevant factor for choosing a communication channel. Trends in customer service show 50% make their choice based on how fast they need a response.
(CX Trends Report)
30. 20% of customers reported contacting customer service via email in 2020.
Companies with good customer service will obligatorily provide several ways for people to reach them. Such companies have a competitive advantage in the market. Besides a phone call and a text message, customers should be able to send an inquiry online. Both social media and email are exponentially growing as popular communication methods for customer service and support. 20% of people reported using email for this reason in 2020.
(Statista)
Post-COVID-19 Customer Service Stats
31. The pandemic has raised standards for 72% of business buyers.
B2B standards have always been higher than those of consumers, and 72% of business buyers said last year's crisis had raised their customer service standards. 55% of consumers said so. 80% of business buyers also noted the pandemic raised the expectations of companies' overall digital capabilities, compared to only 65% of consumers.
(Salesforce)
32. Remote work resulted in a previously unseen tech support spike.
Global technology and customer service research show work-from-home brought an unseen increase in information and security issues. Technical support statistics show that internet/connectivity, telephony, network/systems, and security are the most significant customer service problems.
(Harvard Business Review)
33. Nearly two-thirds of customers used new support channels.
The acceleration of adopting new channels for customer support was a must. Customers of all age groups report using support channels they haven't before, 64% overall. Millennials and Gen Zers lead in almost every category (AI, email, messaging, VR/AR, web chat, social, etc.) Customer service stats show 73% of first-time users plan to continue using said channels.
(CX Trends)
34. During the pandemic, nearly half of US consumers switched brands.
In times of global uncertainty, the pandemic shifted some core values in people, even loyalty. Many people were bulk-buying and creating supplies, especially after shutdowns and border lockdowns. 46% of US consumers admitted they've switched from a regular brand or a retail store at some point.
(McKinsey)
35. Social messaging saw 110% y-o-y growth in 2020 as a preferred communication method for customer service.
When the customers' preferred channels for resolving customer service issues were compared for 2020 and 2021, social messaging had the most significant growth. Social media customer service stats show these preferences were previously at 10%. The levels increased to over 20% in a year, with a whopping 110% growth rate.
(CX Trends)
36. Easy online transactions have become one of the priorities for just under two-thirds of customers.
As life shifted to the virtual platforms, contactless purchases and ecommerce have become the new standard. 65% of consumers believe one of the top priorities for a company is creating a pleasant and easy online payment process. Mobile payments saw a staggering 80% jump from March to June 2020.
(CX Trends)
37. Statistics on customer service jobs show 50% of agents started working fully remotely.
Since the beginning of the pandemic, half of the customer agents have started working from home. As in every other non-essential industry, the tasks don't require gatherings. While having its benefits, at the same time, 46% of them feel like they're missing some tools to work as successfully from home.
(CX Trends)
38. Safety guidelines are essential for the in-store customer experience.
We live in an experience-based economy, so simply making a product available to the end-user is not enough. Health and sanitation were the most significant concerns during the last year and still are. Strictly following safety guidelines was essential for half of the customers. 59% further said the store needed not to be too crowded, while 30% emphasized regular disinfection and cleaning.
(McKinsey)
39. Customer service via messaging apps had up to a 100% increase.
The pandemic boosted the already rising trend of messaging apps, and support requests via messages have never been higher. Trends in customer service show WhatsApp has spiked with a 100% increase in usage since the pandemic started, and web chat, in general, has climbed over 80%. Self-service apps, Facebook messaging, and other social media channels were also about 60% up in their weekly volume of requests.
(CX Trends)
40. In 2020, 71% of customers said they pay more attention to companies' values than in 2019.
Customers nowadays have more options than ever, and they set their bars much higher. For 90%, it's not enough to state your values, but rather act on them. Ethical use of tech, reducing carbon emissions, advocating for human rights, and a workforce reflecting their communities are essential issues.
(Salesforce)
41. 65.6% of UK consumers say they appreciate customer service representatives more since the crisis.
Customer service statistics for the UK report that people recognize and appreciate representatives’ roles, especially amidst the coronavirus crisis. Almost two-thirds of consumers value the role more than before the pandemic. 32.6% report no change, while 1.8% said they value the role less.
(UK CSI)
US Customer Service Data by Industry
42. The American Customer Satisfaction Index for airlines soared to an all-time high in 2020.
An April-September 2020 customer service study reveals peculiar data — the US airline industry had never been rated so high. The travel industry was one of the most affected by the pandemic, but it seems that as the comfort rates have improved, fun facts about customer service show the industry reached a satisfaction index score of 76 (out of 100). Reduced number of passengers, carriers blocking middle seats, and shorter lines all account for an all-time high.
(ACSI Matters)
43.The hospitality industry ranked first in expectations to deliver the best customer service, while government services ranked last.
Consumers' expectations regarding particular industries bring out another level of competitiveness within businesses. Customer service importance seems to be the highest for hospitality, financial, food, and healthcare industries, with 80% or more high expectations. Interestingly, customer support facts show the US government ranked last, with only 20% of high customer service expectations.
(ACA Survey)
44. Overall, ACSI across industries is 73.7— the lowest since 2005.
Standards of customer service vs customer care reality are not in sync. As of January 2021, the ACSI score was 73.7. The fall started happening in 2018 when the score was 77. Many factors have contributed to this decline in satisfaction. First, the domestic market became less competitive. Second, as the IT revolution led to significant growth in customer data, analyzing tools need improvement, specifically in terms of cause-and-effect regarding customer behavior and patterns. ACSI is important because it’s a predictive factor for consumer spending and GDP, thus the decline means a more fragile economy.
(The ACSI)
45. Commerce and agriculture are the best-ranked federal departments with an ASCI score of 74.
Customer service is the most significant aspect for the largest part of the US population, 74% of consumers. Performance of government services and agencies plummeted to 65.1 in 2020. That was a steep 3% decline from the year before. Customer satisfaction statistics show both commerce and agriculture were ranked at the top with a 74 score.
(The ASCI)
FAQ
How important is customer service?
Customer service is an asset crucial no matter the size of a business. There is a direct correlation between customer service and retention, loyalty, referral rates, and revenue levels.
What are the 3 Ps of customer service?
Customer service fun facts show the 3 Ps refer to the most significant customer service areas — people, product, and process. Experts in the field claim that is the golden rule for an exceptional experience.
Can customer service increase sales?
The answer is a resounding yes here. It goes both for the existing customers and the acquisition of new ones. Some examples of customer service importance are: 93% of satisfied customers are likely to make repeat purchases, and 62% will pay more money.
Will customer service be replaced by robots?
Chatbots and automation processes can undoubtedly boost the customer service industry, but it is unlikely that AI will completely replace human agents. Some issues are more complex and require negotiations, critical thinking, etc.
How will customer service change in the future?
Customer service statistics show the latest predictions point to an increase in video and social media communication, AI, bots, self-service, etc. Overall, it will be more personalized and data-driven, with technology assisting agents in the field. The use of new technologies (especially AR/VR) implies new positions being created.