
Being up-to-date with the latest ecommerce trends is not just critical for online business owners today but also for those whose business is predominantly in-store based. As these latest ecommerce statistics show, the world's commerce continues to move online at a neck-breaking pace, having rapidly accelerated since the global pandemic started. So, read on to learn the most important stats and facts that can propel your ecommerce business forward this year and beyond.
Ecommerce Statistics (Editor's Choice)
- E-retail totaled over $4.9 trillion in 2021. (Statista)
- Cross-border ecommerce sales worldwide grew over 20% in 2020. (Forbes)
- US ecommerce grew by over 14% in 2021. (Digital Commerce 360)
- Amazon's net profit increased by over 80% in 2020. (Forbes)
- Over half of consumers use smartphones for shopping. (Oberlo)
- There are over 3.8 billion ecommerce users worldwide. (CSA)
- China is the world leader in ecommerce. (eMarketer)
- Germany and the UK are the most significant European ecommerce markets. (PostNord)
General Ecommerce Stats
1. The ecommerce market value exceeded $10 trillion in 2020.
The ecommerce market size was valued at $9.09 trillion in 2019 and reached $10.36 trillion in 2020. Ecommerce worldwide is projected to grow at a 14.7% CAGR from 2020 to 2027, with revenue for 2027 pegged at a whopping $27.15 trillion.
(Grand View Research)
2. E-retail totaled over $4.9 trillion in 2021.
Online shopping has become a regular aspect of everyday life, especially for young adults. 2021 made even more people adopt the trend, and ecommerce growth statistics show retail ecommerce sales amounted to $4.93 trillion in 2021. This year e-retail sales should climb to $5.54 trillion.
(Statista)
3. Fashion is the largest segment of B2C ecommerce.
The fashion and apparel industry, including clothing, shoes, bags, and accessories, was estimated at over $759 billion in 2021 and is expected to exceed $1 trillion by the end of 2025. That said, the sector looked shaky in 2020. Online sales statistics for fashion reveal that this segment saw a 15% increase year-over-year.
(CSA)
4. Cross-border ecommerce sales worldwide grew over 20% in 2020.
The latest data shows 55% of online shoppers made a cross-border purchase in 2020. The majority of consumers trying this for the first time are likely to continue even after some kind of normality returns in our lives. The ease of purchasing and disruptions in items in stock at home caused cross-border purchases to increase by 21% over the course of 2020. This means that brands and digital marketers should consider revamping strategies, adding more nearby territories in long-tail keywords, etc.
(Forbes)
5. US ecommerce grew by over 14% in 2021.
The unprecedented situation with the pandemic led to results that weren't expected for a few more years. Out of necessity, ecommerce adoption rates skyrocketed, with US consumers spending $870.78 billion online. That's nearly a quarter of the total retail sales for the year. Ecommerce growth stats show the total for 2021 was 14.2% higher than in 2020. Meanwhile, the previous year-on-year increase was 31.8%.
(Digital Commerce 360)
6. Online retail ACSI fell to its lowest point since 2015.
The 2021 report on the American Customer Satisfaction Index shows a decline compared to 2020 due to various disruption factors caused by the pandemic. The overall score for internet retail saw a 2.3-point YOY drop and was 75.5 out of 100 in 2021. The score had been 80 or higher since 2014. Every examined aspect deteriorated, as these ecommerce stats during COVID show, the two with the biggest drop of 5 and 4 points being usefulness of product images and frequency of sales and promotions, respectively.
(Business Wire, ASCI, Statista)
7. The average cart abandonment rate is close to 70%.
Different studies show results ranging from around 50% to over 80% for the average cart abandonment rate in online shopping. Various factors during the process can impact this, especially during checkout, and ecommerce stats show the average from all the data compiled is 69.8%. Choosing the right ecommerce platform is an essential aspect of conducting your business online, as a smooth customer experience can significantly reduce the abandonment rate.
(Baymard)
Learn more: Ecommerce KPIs
8. Extra costs are the primary reason for cart abandonment in the US.
When US online shoppers were asked to cite the most frustrating parts of ecommerce that lead to abandoning their carts before making a purchase, hidden or extra fees ranked first, with 48% of respondents choosing the reason. Obligatory account creation was second for 24%, while slow delivery ranked third, with 22% of consumers saying so. Shopping cart abandonment stats further reveal that ecommerce businesses lose $18 billion every year due to the increasing shopping cart abandonment rates.
(Baymard)
Learn more: Ecommerce Metrics

9. Amazon's net profit increased by over 80% in 2020.
Amazon's net profits were up 84% in 2020 as compared with the year before. Ecommerce statistics worldwide show the company's revenue increased 38% and reached an all-time high of $386 billion. That was unprecedented growth in a year, but before getting amazed by the numbers, we should consider the overall ecommerce growth. The boost that happened in 2020 was supposed to develop over several years gradually.
(Forbes)
10. eBay's annual net revenue exceeded $10 billion for the first time in 2020.
The global platform had several significant milestones in 2020, one of them being net revenue of $10.271 billion, as ecommerce growth statistics for eBay show. Even though it came close to this in 2017 with $9.93 billion, what followed was a decrease, hovering around $8.6 billion for a couple of years. Besides its net revenue, another milestone of reaching $1 billion happened in the advertising segment revenue.
(eBay, Statista)
11. Shopify's revenue grew over 85% in 2020.
Another internet-based company also enjoyed a rise in 2020. The Canadian ecommerce giant’s products are available in 175 countries worldwide, and the company reported a 94% increase in Q4 2020 revenue compared to the prior-year quarter. For the whole year, Shopify's revenue grew 86%.
(Shopify)
Mobile Ecommerce Statistics
12. There are 3 types of mobile commerce.
Statistics about mcommerce show various transactions are included in the concept. They are categorized into:
- Mobile shopping (ecommerce from mobile devices);
- Mobile banking (online banking through a dedicated app);
- Mobile payments.
(BigCommerce)
13. Over half of consumers use smartphones for shopping.
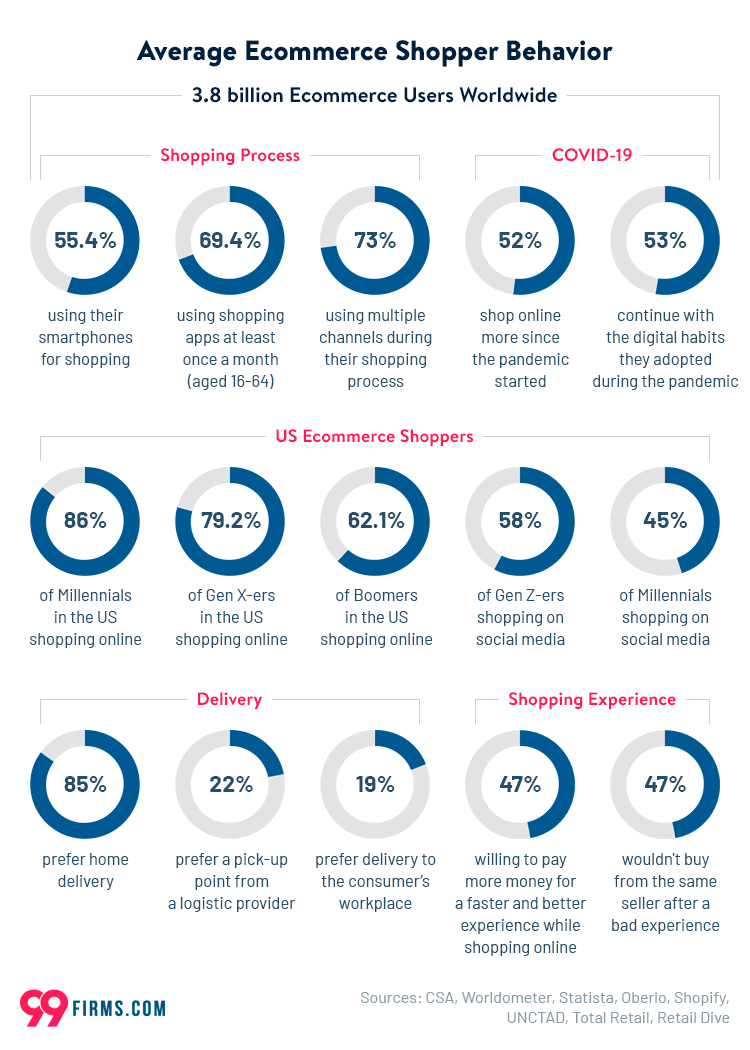
Mobile is the future of online shopping, and mobile traffic already accounts for over 55% of the total. Global ecommerce statistics show the percentage of consumers using their smartphones for shopping also exceeded half, accounting for 55.4% of global ecommerce sales in 2021. This is due to multiple factors, such as Instagram’s in-app purchases, and social media marketers are using the fact to their advantage. For internet users aged 16-64, the percentage is even higher for using shopping apps at least once a month, or 69.4%.
(Statista, Oberlo)
14. Shopping apps rank higher for iOS users.
When we look at ecommerce data regarding downloaded apps in 2020, there is a significant difference in popularity between Android and iOS mobile users. Shopping apps rank in 9th place for Android users and the 5th for iOS users. These rankings tell us only about typical user behavior, not the overall popularity, as there are more Android users overall, keeping the best Android app developers busy.
(We Are Social)
15. Shopee was the most downloaded shopping app in 2021.
Amazon, the global leader in a variety of sectors and products fell from first place to fourth, while the title of the most downloaded shopping app in 2021 went to Shopee. It was downloaded 203 million times worldwide, which is an increase of 46% compared to 2020.
(Marketplace Pulse)

Online Shoppers: Statistics and Trends
16. There are over 3.8 billion ecommerce users worldwide.
In 2020, the number of ecommerce shoppers skyrocketed to exceed 3.4 billion as a consequence of the pandemic. No one could've predicted such a jump in several months only, and as the necessity disappears, growth is predicted to slow down a bit. Nevertheless, the number means over 43% of consumers worldwide shopped online in 2020. Based on 2021 projections the number of ecommerce worldwide users should have already reached 3.8 billion, and that 48.1% of the global population shopped online last year.
(CSA, Worldometer)
17. Almost three-quarters of consumers use multiple channels before buying.
The omnichannel strategy has been an absolute necessity for a while now, as shoppers' journey doesn't end on the vendor’s website, they will track your social media pages, compare prices on similar items, etc. Ecommerce sales statistics show a staggering 73% of buyers report using multiple channels during their shopping process. If you're still not convinced you should go with the multichannel approach, brands that wisely invested in ecommerce SEO services report a 190% or higher increase in their revenue. Make sure to include social media, sell on ecommerce giants such Amazon or eBay, and promote your business on search engines.
(Shopify)
18. Over half of the consumers agree they shop online more since the COVID-19 outbreak.
The United Nations conducted a survey to examine the impact of the pandemic on online shopping, and their sample included all global regions. Ecommerce industry statistics clearly state that most consumers switched to digital, with 52% agreeing they shop online more since the pandemic started. Additionally, 53% agree they will continue with the latest digital habits they adopted during the pandemic.
(UNCTAD)
19. Over 86% of millennials in the US shop online.
The statistical data for US ecommerce shoppers point to Millennials being the most prolific group, with 86.2% of them doing so. However, ecommerce demographics also include a large number of older users — Gen X follows with 79.2% buying online, and for Boomers, the percentage is 62.1%.
(Statista)
20. Almost 60% of Gen Z used social media for shopping.
New kids on the block aged up to 25 are called digital natives, so what does that mean? Simply put, they don't know life without the internet and social media. Influencers are heavily targeting them in their campaigns, and it works. 58% of Gen Z-ers report buying on social media, primarily Instagram. Ecommerce stats show for the other group of young adults, Millennials, the percentage is 45%.
(Total Retail)
21. There are 426 million PayPal active users.
PayPal is one of the most commonly used payment systems by ecommerce services. It allows easy transactions in many currencies, and the service reported 426 million active users at the end of 2021. PayPal transactions during the pandemic show it was the most popular payment method in Germany and Italy, for 72% and 71% of consumers. In Switzerland, it was the payment method of choice for 51% consumers, and ecommerce stats for South Africa also point to PayPal as fairly popular, favored by 40% of online shoppers.
(Statista, UNCTAD)
22. Home delivery is the preferred option for most online consumers.
Ecommerce facts show that home delivery is the most favored option for most consumers globally when they shop online (85%). Next on the list is a pick-up point from a logistic provider with 22%, followed by delivery to the consumer’s workplace with 19%.
(UNCTAD)
23. The tourism and travel industry suffered the most significant drop in 2020.
2020 brought lockdowns, and most countries closed their borders for extended periods to prevent the spread of the coronavirus. As shown in these ecommerce stats, during COVID, the decline in tourism and travel spending was 75%. Global ecommerce sales of flights and other transportation methods were included in the report, along with hotel bookings.
(UNCTAD)

24. Half of consumers are buying products online they haven't before.
Many new product categories have been introduced into “regular” consumer behavior and 50% report buying something online they hadn’t before. Ecommerce statistics show some of the top categories are:
- Groceries;
- Household items;
- Toys and sports equipment.
(Bloomreach)
25. Half of consumers would pay more for a better online shopping experience.
Customer experience is a product equally relevant as the one consumers are actually purchasing. 47% report they are willing to pay more money for a faster and better experience while shopping online. With close to half consumers further admitting that they wouldn't buy from the same seller after a bad experience, it seems that hiring an ecommerce development company to ensure a top online shopping experience pays off in the long run.
(Retail Dive)
Amazon Online Retail Sales Statistics
26. Consumers spent over $11 billion during the Prime Day event in 2021.
Prime Day has become the new Black Friday. The 48-hour ecommerce worldwide sales event was held in the summer between June 21 and June 22. The ecommerce giant’s sales levels exceeded a whopping $11 billion, and Amazon's Prime members bought more than 250 items during the event.
(Digital Commerce 360)
27. Third-party sellers earned over $3.5 billion during the 2020 Prime Event.
The company is a channel for third parties to advertise their business and sell their products. Ecommerce sales statistics show that in 2020, $3.5 billion went to third-party sellers. The same data is not available for 2021, as Amazon stopped sharing sales figures.
(GeekWire)
28. Over 50% of products on Amazon are from SMBs.
The company is proud of enabling small and medium businesses to appeal to larger audiences, promote their brand, and sell directly on Amazon's website. Ecommerce statistics show its virtual shelves have been available to them since 2000, nowadays in 130 countries worldwide. Over half of the products on Amazon come from SMBs.
(Amazon)
29. Amazon's market cap exceeded $1.7 trillion as of June 2021.
Ecommerce industry statistics point to another aspect in which Amazon positions at the top; its market cap value at $1.735 billion. Alibaba ranked second with $614.8 billion. There is no other internet-based company that can come even close to the two, as Shopify, PinDuoDuo, and Prosus that rank in the top 5 have $182.1, $159.2, and $158 billion, respectively.
(Statista)

30. Amazon accounts for over 43% of US ecommerce sales.
Boosted by COVID-19, other ecommerce players gained a large portion of the market. Online shopping growth statistics show Amazon's share grew from 418% in 2020 to 43.5% in 2021. Many companies offered online sales for the first time as a response to COVID-19, and as it turns out, they only needed a little guidance from digital strategy professionals.
(Digital Commerce 360)
31. Amazon is by far the most visited e-retail website.
When examined by the average monthly traffic, Amazon ranks first, having 3.67 billion monthly website visits in 2020. That's over 3 times higher than the second place holder, eBay, which had 1.02 billion. Rakuten, Samsung, and Aliexpress also had over half a billion, while Walmart came close to that milestone with 492 million monthly website visits.
(Statista)

Global Ecommerce Statistics
32. There's a strong correlation between increased ecommerce popularity and COVID-19 anxiety in selected European countries.
The variable of COVID-19 cases throughout Europe showed direct reflection in the popularity of ecommerce and countries with a high number of cases. Anxiety and fear that led to an increase in online shopping were proportional to the number of recorded cases amidst the pandemic. Consumers in Spain, Belgium, Italy, The Netherlands, and Poland reported shopping online more often.
(PostNord)
33. Latin America noted the highest ecommerce growth in 2020.
Global online shopping statistics show that the fastest growth in ecommerce sales worldwide happened in Latin America. The increase was 36.7%, compared to 2019. North America ranked second with a YOY change of 31.8%. The region of Central and Eastern Europe saw a 29.1% increase. The average growth on a global level was calculated at 27.6%.
(eMarketer)

34. China is the world leader in ecommerce.
China alone was expected to make up for exactly one-third of digital buyers in 2021. Online shoppers statistics show that's 792.5 million people. Not only it ranked first in the number of people engaging in ecommerce, but it was also expected to become the first country where over half of all retail sales would happen online in 2021. China should also produce 56.8% of the global total, i.e., over $2.8 trillion in ecommerce sales.
(eMarketer)
35. The US is the second-largest market worldwide.
The US ranks second, with ecommerce being a 19% share of the total retail sales and $843 billion in annual sales. Even though it sounds quite impressive, ecommerce statistics reveal China has almost triple the percentage — 52%—and $2.78 trillion in online annual sales. The rest of the top 10 ecommerce markets go as follows:
- The UK ($169 billion, 4.8%)
- Japan ($144 billion, 3%)
- South Korea ($120 billion, 2.5%)
- Germany ($101.5 billion, 2.1%)
- France ($80 billion, 1.6%)
- India ($67.5 billion, 1.4%)
- Canada ($44 billion, 1.3%)
- Spain ($37 billion, 0.72%).
(Business)

36. Germany and the UK are the most significant European ecommerce markets.
It's no coincidence the largest European markets are the two countries where Amazon has been available the longest. The US ecommerce giant has been present in Germany and the UK since 1998. Online sales statistics show shoppers spent €62.8 billion in Germany and €52.4 billion in the UK in 2020. France, Spain, and Italy complete the top 5 list with over €30 billion spent in each country.
(PostNord, Pattern)
37. Close to 50 million UK consumers shop online.
The current population of the UK is just over 68.5 million people. With 49.3 million consumers shopping online, the country ranks as the third-largest ecommerce market, right after China and the US. The 2021 report of ecommerce statistics for the UK points to a whopping 95% of consumers aged 15-79 buying online.
(PostNord, Worldometers)
38. Canada's ecommerce grew over 70% in 2020.
While ecommerce accounted for a small portion of Canada's total retail sales, the increase was nevertheless impressive. The latest ecommerce statistics for Canada show that throughout 2020, the growth of ecommerce levels was at a stunning 72.7%, which is quite a jump from the 22.1% growth in 2019.
(Media in Canada)
39. Over 13 million people in Malaysia shop online.
88.3% of internet users in Malaysia said they use shopping apps on their mobile or tablet devices. Some of them seem to be just browsing online stores, as 82.9% report actually shopping online. We've already mentioned many people browse to compare the prices while in brick and mortar stores, so the numbers add up. The latest ecommerce statistics for Malaysia reveal 13.10 million people shop online.
(DataReportal)
40. Curbside pickup options for top retailers in the US and Canada increased almost 40% in the first 8 months of 2020.
As health and safety issues became one of the top priorities in shopping, companies had to swiftly adapt to their customers' expectations. In December 2019, only 6.9% of the top 500 retailers in the US and Canada offered the option of curbside pickup. Fast forward to August 2020, the percentage among the same retailers was 43.7%. During the peak of the pandemic, Adobe also examined this aspect, and the results for several critical weeks in April 2020 point to a 208% increase in curbside pickups in the US.
(Digital Commerce 360, Supply and Demand Chain Executive)
41. The ecommerce penetration rate in Singapore is close to 80%.
The latest ecommerce statistics for Singapore point to a high rate of online shoppers, i.e. 79.7% of total internet users aged 16-64. Even more, 89.4% say they've visited online shops. The majority of ecommerce shoppers in the country (or 56.9%) further use mobile devices to do so.
(DataReportal)
42. In the Philippines, ecommerce is most popular for the 35-44 age group.
The Philippines are also among the ecommerce markets where over 80% of internet users are shopping online. Close to 70% report doing so via their mobile device. Ecommerce statistics for the Philippines show online shopping is the most popular for people aged 35-44. 86.9% of internet users within this age group shop online. The total value of the Philippines' B2C ecommerce market was last reported at $3.55 billion.
(DataReportal)
43. In Australia, the biggest growth in consumer ecommerce in 2020 was in the food and personal care industry.
The percentage of internet users aged 16-64 who shopped online Down Under was 74.9% in 2020. Interestingly, less than half report shopping via mobile devices. Ecommerce facts show that travel, mobility, and accommodation had the most significant drop, as in every other county worldwide, reported at 46.4%. On the other hand, ecommerce statistics for Australia point to food and personal care products seeing the highest YOY growth of 30.4%. The category of digital music followed with a 25.9% increase.
(DataReportal)
44. India’s ecommerce market is poised to reach $200 billion by 2026.
The “Digital India” program conducted by the Government is doing exactly what the name states. Rapid urbanization is carried out by the rising internet and smartphone penetration rates, with a whopping 97% of connections being wireless. The two are also mirrored in India's ecommerce market growth, which was valued at only $38.5 billion in 2017. Ecommerce statistics for India project that the market will rise to a stunning $200 billion by 2026.
(IBEF)
Wrap-Up
Ecommerce and mcommerce were growing at a much faster pace than overall commerce even before the pandemic started. We are yet to see the exact consequences of COVID-19, but these ecommerce statistics already tell a lot about the changes that happened, both objectively and in consumers' perception of shopping. Factors such as the availability of affordable devices and improved infrastructure on a global level further support forecasts that most of the world's commerce will move online in the near future.
Sources
- Statista
- Forbes
- Digital Commerce 360
- Forbes
- Oberlo
- CSA
- eMarketer
- PostNord
- Grand View Research
- Business Wire
- ASCI
- Statista
- Baymard
- eBay
- Statista
- Shopify
- BigCommerce
- Statista
- We Are Social
- Marketplace Pulse
- Shopify
- UNCTAD
- Statista
- Total Retail
- Statista
- Retail Dive
- Digital Commerce 360
- GeekWire
- Statista
- Statista
- Business
- Pattern
- PostNord
- Worldometers
- Media in Canada
- DataReportal
- Digital Commerce 360
- DataReportal
- DataReportal
- DataReportal
- IBEF
- Supply and Demand Chain Executive