From printed posters and leaflets to website visuals, the elements of design are stitched into every fiber of our everyday life. With the surge of companies doing business online, attention turns toward graphic design to help engage users through visuals across different touchpoints. We’ll dive into the latest graphic design statistics to show you the importance of the industry, what drives its growth, and how your business can benefit from it. Stay tuned.
Graphic Design Statistics (Editor’s Choice)
- The global graphic design market is worth $45.8 billion. (FinancesOnline)
- Freelancers comprise 90% of the graphic design market. (FinancesOnline)
- The employment of graphic designers in the digital area is expected to grow 3% between 2020 and 2030. (BLS)
- The average age of a graphic designer in the US is 37. (Zippia)
- Posts with images generate 650% higher engagement than those without images. (Smart Bird Social)
- 73% of companies are making design investments to outmatch the competition. (Adobe)
- Around 40% of organizations want to automate the graphic design process. (Venngage)
- Good design accounts for 75% of the website’s credibility. (fatBuzz)
General Stats and Facts About Graphic Design
1. Color is the trigger behind 62-90% of consumer decisions.
Statistics suggest that color is the most important differentiator impacting customers’ decisions about a brand. Since people are found to make up their minds regarding a particular company within the first 90 seconds, the design and colors on your website or product are vital to grab and keep their attention.
(ResearchGate)
2. Posts with images generate 650% higher engagement than those without images.
Content with images engages more people. Such posts are also 40% more likely to get shared on social networks. Facebook posts with images register 2.3 times more engagement, graphic design facts show.
(Smart Bird Social)
3. Humans process visuals 60,000 times faster than text.
Did you know that the human average attention span is eight seconds, even less than that of a goldfish? This fact further underscores the importance of visuals in brand messaging.
(Entrepreneur)
4. Some 65% of B2B marketers like to use infographics.
This compares to 59% for B2C marketers. Aside from infographics, 56% of B2B marketers and 67% of B2C like to use illustrations and photos, facts about graphic design show.
(Foap)
5. 73% of companies invest in design to outmatch the competition.
Brand differentiation in highly competitive markets is a must for survival. Research shows that most companies are investing in design to enhance it. What’s more important, it seems that it pays off, with design-driven companies seen as 69% more likely to accomplish and surpass their targets.
(Adobe)
6. Nearly a third of surveyed companies used original graphics in their content in 2021.
Original graphics are an essential part of many companies’ marketing activities, with 32.5% reporting to have used them in 2021, according to graphic design statistics. Stock photos took the second spot with 29.5%, followed by charts and data visualizations with 15.1%.
(Venngage)
7. 92.6% of people point to the visual dimension as the most important factor influencing their purchase.
Visuals are the key to reaching the customers. Stats show that for the majority of people, they overpower the taste, smell, etc.
(Neil Patel)
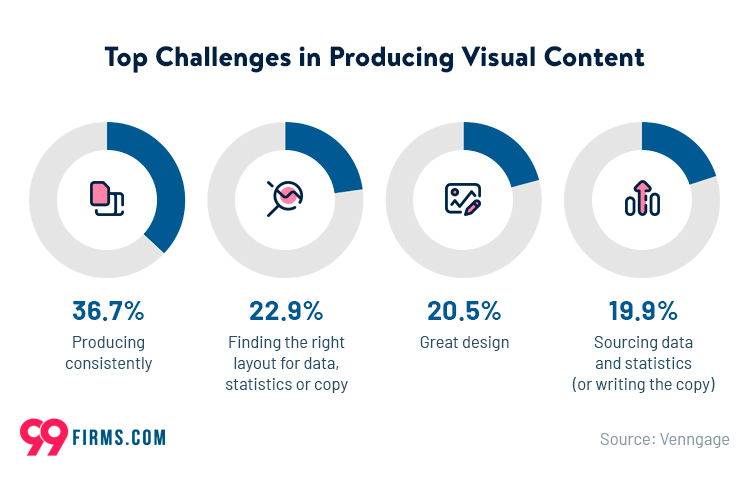
8. The biggest challenge for nearly 37% of content marketers is generating graphics regularly.
Marketers face several key obstacles to producing design and visuals. For over a third of those surveyed (36.7%), consistency in the production of visual designs is the number one roadblock. Graphic design facts show that finding the appropriate layout is the second-biggest challenge with 22.9%, followed by great design with 20.5%, and sourcing data with 19.9%.
(Venngage)
9. 36% of marketers use online graphic design tools to create visuals.
Automation is the next big thing in this industry, too, with over a third of marketers betting on graphic design software. Alternatively, 29% use in-house designers, and 19% bet on the likes of Adobe. Finally, 15% rely on freelancers.
(FinancesOnline)
10. Nearly 40% of organizations want to automate the graphic design process.
Automation of graphic design production has been one of the most popular graphic design industry trends, as it allows businesses to be consistent in producing graphical visuals, infographics, eBooks, etc. 64% of companies, meanwhile, say that their strategy relies heavily on visual content.
(Venngage)
Website Graphic Design Facts
11. It takes about 50 milliseconds for a person to form an opinion about a company’s website.
First impressions are all that matter in the context of website design, with the type of font, symmetry, structure, colors, spacing, and amount of text all playing a part. Web design statistics further reveal that first impressions are 94% related to design, visual appeal, and website navigation.
(8 Ways Media)
12. 94% of people would abandon a poorly designed website.
Good website design is a prerequisite for people wanting to purchase products on your website or convert otherwise. The fact that customers will buy your product only because it looks nicer than the one from the competition is one of the repeatedly confirmed facts about graphic design. It shows a strong connection between good web design and high conversion rates.
(Red Website Design)
13. A good design conveys 75% of the website’s credibility.
Credibility is as important for websites as is user-friendliness. Nearly half of all users agree that website design shows the credibility of the entire business, which explains why so many companies are working with the top web designers to help them meet their visitors’ expectations.
(fatBuzz)
14. 38.5% of web designers consider outdated design the number one reason visitors leave a website.
A significant number of web developers and web development companies agree that outdated website design can drive customers to drop the company. Research has shown that the average lifespan of a website is up to 2.5 years. Everything past that point requires the introduction of a new design to make it more competitive, graphic design statistics confirm.
(HubSpot)
15. Infographics can drive website traffic by up to 12%.
Original graphics are one of the best forms of visuals and a powerful way to drive engagement. Apart from raising brand awareness, they help direct the traffic to the web. For that, brands have many online infographic generators available to them, while another common practice is to hire an agency specializing in infographic design.
(Search Engine Watch)
Graphic Design Industry Statistics
16. The global graphic design market is $45.8 billion worth.
The graphic design industry grew 2.2% in 2021. The global annualized market growth between 2016 and 2021 was 2.8%.
(FinancesOnline)
17. The US graphic design industry value is $12.7 billion.
The US is one of the largest graphic design markets with an average growth rate of 4.1%, outperforming the global market. The rate accelerated in 2021, from a negative 1.6% growth seen between 2016 and 2021.
(FinancesOnline)
18. Logo design and branding contribute $3 billion to the total graphic design market size in the US.
Logo design and branding are the key pillars of the graphic design sector in the US. In fact, they comprised about a quarter of the total graphic design industry worth in 2021.
(DDIY)
19. The number of graphic design-related businesses in the US was 16,823 in 2019.
Graphic design facts from the Design Management Institute show that the businesses’ focus on design outgrew S&P companies by a staggering 219% between 2004 and 2014. Organizations that foster creativity meanwhile are shown to increase their market share by at least 1.5 times.
(AALofts Design)
20. The federal executive branch pays graphic designers in the US the most.
Some industries are more lucrative for designers than others. The annual mean salary in the federal executive branch is $88,090, followed by the $81,610 paid by software publishers. Aerospace products and parts manufacturing come in third with $80,000. Finally, cable services and legal services have a $77,090 and $77,790 mean salary, respectively, graphic design facts and stats show.
(BLS)
21. Roughly 65% of small businesses would pay only $500 for the design of a logo.
The cost of design could be impeding a stronger graphic design industry growth. However, some smaller companies would pay up to $1,000 for a logo design (20%), or even more than that (15%). Given such constrained budgets, over 50% of companies design in-house, 21% hire freelancers, and 18% start crowdsourcing contests on various platforms. Ultimately, just 7% hire a design agency.
(99designs)
22. In 2020, the average annual wage for graphic designers in the US was $53,380, graphic design statistics indicate.
Graphic designers in the US could have a solid median wage. However, it all depends on many factors, including experience, quality of work, etc. So, for instance, the lower 10% of the spectrum earns less than $31,720, while the top 10% earn an astonishing $93,440 annually.
(BLS)

23. Designers working in advertising and related services have the highest median annual salary of $55,800.
Other noticeable areas include specialized design services, earning almost the same with $54,840. Moreover, looking at the graphic design industry trends, we can see that designers working for newspapers, books, periodicals, and directory publishers earn $45,170. Finally, printing and related activities have $41,490 annually.
(BLS)
24. The number of graphic design positions is set to grow 3% between 2020 and 2030.
The demand for graphic designs might be slower than other occupations, but it’s still constantly on the rise. Despite the limited growth, the industry will see 23,900 new open positions to fill in the void, graphic design statistics show.
(BLS)
25. Freelancers represent 90% of the graphic designers in the market.
The graphic design employment rate among freelancers is expected to surge further in the wake of the global pandemic, with the demand for online design likely to soar.
(FinancesOnline)
26. Of 25,000 people who try to become graphic designers, 60% last the first two years.
The job of a graphic designer is not a walk in the park. One of the interesting graphic design facts is that 40% of people who enter the field quit after two years. After five years, a third of those remaining stick around.
(The Princeton Review)
27. 36% of companies with more than 10,000 employees hired graphic designers.
Larger companies with a large number of employees are most likely to have graphic designers in their workforce. Similarly, those with 1,000 to 10,000 employees are second on the list (34%). 12% of companies with between 500 and 1,000 employees have graphic designers positions. Graphic design statistics further show that only 6% of companies with 50 or fewer employees and 3% of those employing 50 to 100 people have graphic designers in their ranks.
(Zippia)
28. Hourly rates for freelance designers stand at around $31.25.
The average graphic design rates range between $15 and $150 per hour, depending on the type of employment or level of expertise. Some freelancing junior graphic designers charge even less, like $13, which affects the market.
(Eksposure)

Graphic Design Demographics
29. The average age of a graphic designer in the US is 37.
Judging by the graphic design industry statistics, most graphic designers in the US are over 40 years old (39%). Following this group, 30-40-year-olds account for 34%, while 20-30-year-olds are the third group with 27%.
(Zippia)

30. Women and men are evenly balanced among graphic designers with 48% vs 47.6%.
Despite this gender balance, there is inequality of pay. Women earn 95 cents for each dollar a man earns. So, where a male graphic designer earns $49,042 annually, a female one would earn $46,830.
(Zippia)
31. 76.1% of all graphic designers in the US are of white ethnicity.
Compared to other ethnicities, white is the most dominant one. The next ethnicity is Hispanic, with 10.2%. Around 7.6% of all graphic designers are Asian. Finally, 3.5% are African American.
(Zippia)
Interesting Facts About Graphic Design
32. The right color scheme improves readability by up to 40%.
The appropriate color can boost readership, given that it's one of the first things the brain perceives. A signature color, therefore, can increase brand recognition by 80%, branding statistics show.
(Crowdspring)
33. Then student Carolyn Davidson designed the famous Nike logo for $35.
That’s a fact you probably didn’t know unless you are a graphic designer or loyal Nike fan. But that’s not the only famous logo designed for a couple of dollars, or even free of charge, logo facts show. However, Carolyn ended up earning a bit more than $35 —the company surprised her with shares after Nike went public, with the equity reportedly worth about $1 million.
(LWV Printworks)
34. Egyptians were the first known graphic designers, fun facts about graphic design show.
Aside from setting some standards for modern graphic design, they used their own hieroglyphic marks, which could be considered logos to brand domestic animals. This is thought to have happened in the 13th century BC, making them the first logo designers ever.
(LWV Printworks)
35. The company Performable increased conversion rates by 21% after changing their CTA to red.
The right color can boost conversions. Performable did an experiment changing its CTA from green to red, leaving the other elements intact. This translated into an impressive rise in conversions. Interesting facts about graphic design show that in a similar move, Ript Apparel registered an increase in sales by 6.3% by simply changing CTA from green to yellow. Interestingly, landing page conversion rate stats show green is the most popular CTA color used on 39.4% of landing pages.
(LeadNetwork)
36. 57% of consumers associate the color blue with success.
Colors play a major role in what a customer feels about a particular brand. Apart from success, blue is the color people associate with reliability (43%), trust (34%), and security (28%).
(FinancesOnline)
Conclusion
While print media might be dying down, graphic designers are unlikely to remain unemployed. Instead, the industry is set to grow and graphic design skills are even more sought after with the development of digital channels. Hopefully, these graphic design statistics have illustrated a clearer picture of the shifts currently driving this exciting field.